One dataset. Every audience. Always relevant.
Role-based dashboards built on the same data as your plan, forecast, and actuals. Operators see their cost centre. Finance sees consolidation. Leadership sees the full picture. One dataset, tailored to every audience.
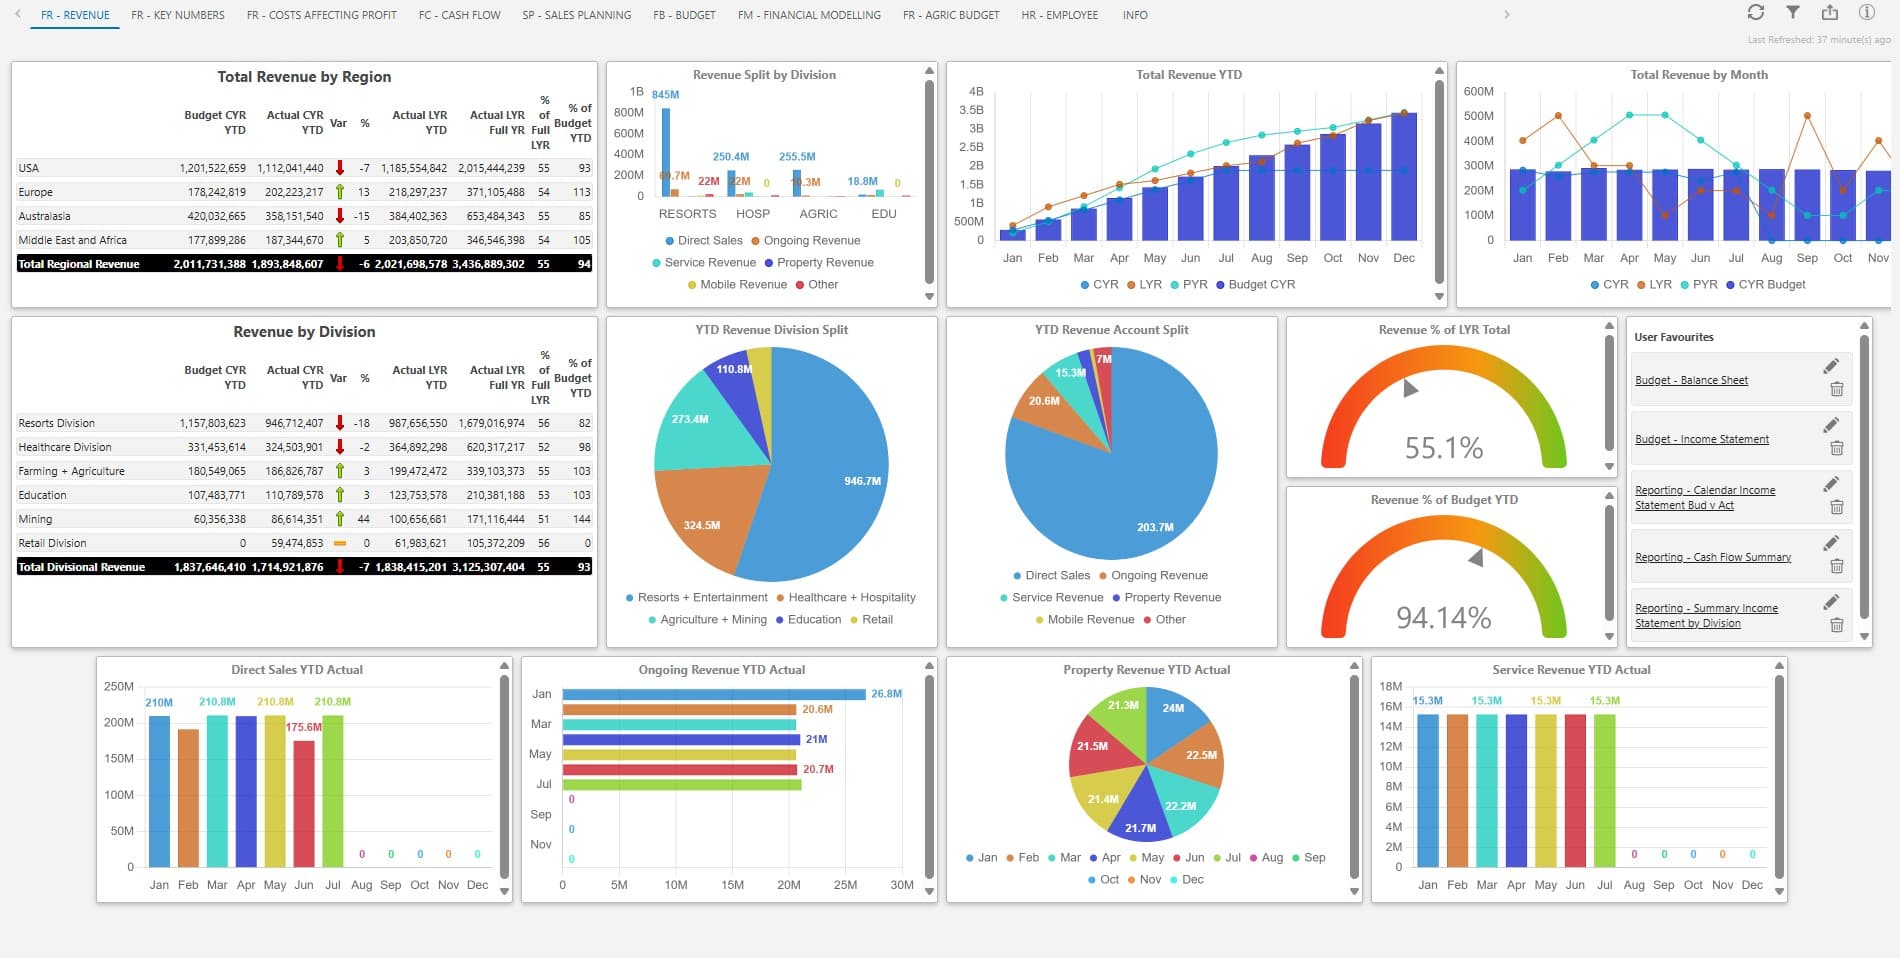
Up-to-date data, role-aware views, insight in every tile.
Always up to date
Dashboards reflect the latest available data based on your scheduled ERP refresh, ensuring users are working with current information.
Role-aware by design
A cost centre owner, a finance manager, and an executive each see the lens they need. The same data is presented differently, based on role and responsibility.
Drill-down in every tile
Click any tile to move from summary metrics to the underlying detail, including customer, product, or transaction level, without exporting data.
Aligned to access control
Dashboards respect the access policies defined in IDU. Users only see the data relevant to their role, with full control and no data leakage.
Insights within each tile
Dashboard Insights analyse the data within a selected tile and provide natural language explanations of performance. Users can quickly understand trends, variances, and key drivers, with insight available down to cost centre and account level.
Dashboards built on the same data as your plan.
One source of truth
Plan, forecast, actuals, and dashboard read from the same data structure. No reconciliation between systems.
Configurable, not bespoke
Tile types, KPIs, and layouts are configurable in the platform. No custom development, no consultant required.
Visibility across the organisation
See performance across departments and cost centres in one place, with clear visual insight into trends, variances, and areas requiring attention.
From data to understanding
Dashboards do not just show numbers. Built-in insights help interpret performance, highlighting trends and variances in clear, actionable language.
FAQs about dashboards with IDU.
Are dashboards configurable in-platform or bespoke?
Configurable. Tile types, KPI definitions, and layouts are managed in the platform by your team. No custom development, no consultant lock-in.
Can dashboards be tailored per role?
Yes. Each user sees the dashboard scoped to their role and access policy. Cost centre owners, finance managers, and trustees each get a view tailored to what they own — not a single shared report.
How fresh is the data?
Live. Tiles update as the ERP closes — no overnight ETL gap, no “data as of yesterday” caveat. Frequency aligns with your ERP’s post cadence.
How is data access secured?
Role-based access scopes every metric and drill-down. Operational managers cannot see data above their access level. Encrypted at rest and in transit, hosted on Microsoft Azure.
Can I see my numbers without asking finance?
Yes. You have a live view of your cost centre’s budget, actuals, and variance — on any device, between meetings. Drill from your top-line summary to a single GL transaction without raising a ticket. If finance hasn’t closed the period yet, you see what’s posted to date with a clear “as of” timestamp.

“IDU transformed our budgeting process — faster, more accurate, far more transparent.”

“For the first time we have been able to include more people in the budgeting process, increasing involvement and transparency.”
Open the dashboard. See the lens.
Open the dashboard and view performance in the way that matters to you.